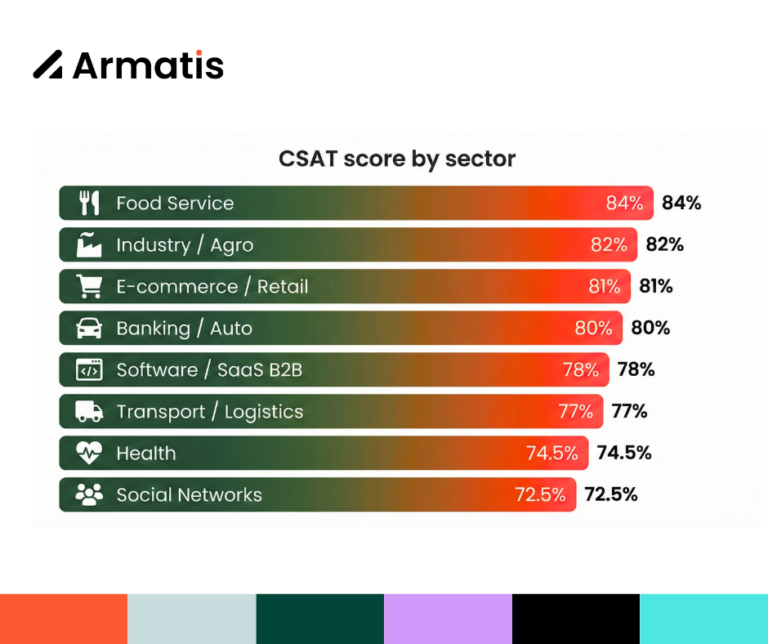
What Is a Good CSAT Score? Discover Your Industry Benchmarks

Share on

You measure customer satisfaction with CSAT, but one question persists: is my score really good? Between raw numbers, industry averages, and result analysis, knowing where you stand isn’t always easy. This article helps decode your CSAT score, benchmark it against industry standards, and analyze it for concrete improvement actions.

Sommaire:
Sommaire:

What Makes a Good CSAT Score: Essential Benchmarks

Before diving into industry benchmarks, let’s establish the basics. The Customer Satisfaction Score (CSAT) measures the percentage of satisfied customers after a specific interaction with your company. It calculates as: CSAT = (Number of positive responses / Total responses) × 100

Positive responses typically mean 4-5 on a 1-5 scale, or “Satisfied” and “Very Satisfied.”

General Reference Thresholds

While each industry has specifics, here are commonly accepted benchmarks:

  • 90%+: Exceptional! You’re in the top 5% of companies
  • 80-89%: Excellent, customers very satisfied
  • 75-79%: Good satisfaction level, high average
  • 70-74%: Acceptable, but improvement room exists
  • 60-69%: Average, time to identify issues
  • 50-59%: Concerning, only half satisfied
  • <50%: Red alert, immediate action needed

Important: A 80% score means 80% satisfied customers, but also 20% dissatisfied. Never overlook dissatisfied proportion.

CSAT Benchmarks by Industry

The real question isn’t just “do I have good CSAT?” but “how do I compare to my sector?” Customer expectations and quality standards vary widely across industries.

For clear, reliable insights, we primarily draw from the American Customer Satisfaction Index (ACSI), a U.S. reference recognized as excellence standard by the federal government. ACSI measures satisfaction across 400+ companies in 40+ sectors. We cross-reference with Forrester Research and Customer Service Quality Benchmark Report for 2024-2025 perspective.

SectorAverage CSATKey ExpectationsTarget Goal
E-commerce & Retail80-82%Seamless buying, fast delivery, easy returns, post-purchase communicationAim for 85% to stand out
Software & B2B SaaS78%Intuitive interfaces, reactive tech support, effective onboarding, regular updatesReach 82-85% in competitive market
Banks & Financial Services80%Transaction security, transparency, personalized advice, quick issue resolutionMaintain ≥80% for trust
Full-Service Restaurants84%Strong emotional experience, direct human contact, immediate satisfactionStay >82% for positive word-of-mouth
Transport & Logistics77%On-time delivery, package condition, real-time info, incident managementReach 80% via better communication
Social Media & Media71-74%Complex content management, varied expectations, simultaneous user satisfaction>75% is notable performance
Healthcare & Medical Services73-76%Strong emotional needs, communication importance, essential trustTarget 78-80% with enhanced listening/empathy
Manufacturing & Agri-Food82%Perceived product quality, consistent standards, reliable processesMaintain via constant quality
Automotive80%High-stakes purchases needing trust, crucial after-sales, long-term relationshipsExcel in after-sales >82%

How to Know If Your CSAT Is Truly Good?

A CSAT score never reads in isolation. Evaluate satisfaction via three complementary analysis angles.

1. Sector Comparison

  • Above average: Competitive, but don’t ease efforts
  • Average: Acceptable, but not differentiating
  • Below average: Alert, customers may switch competitors
 

Note: “Average” means missing customer satisfaction as competitive edge.

2. Time Evolution

Track CSAT regularly (monthly/quarterly):

  • Upward trend: Improvements working
  • Stagnation: Experience not progressing, competitors may overtake
  • Downward: Urgent issue identification

Tip: Build 12-month CSAT dashboard for trends/action impact.

3. Measurement Context

“Good” depends on timing:

  • Post-complaint: 70% excellent
  • Simple purchase: 70% concerning
  • Complex onboarding: 75-80% satisfactory
  • Standard delivery: ≥85% minimum

How to Analyze Your CSAT Score in Depth?

A global figure starts analysis; granular breakdown enables action. Here’s the 5-step method.

Step 1: Analyze Note Distribution

Beyond global score, examine spread:

  • 95% CSAT: 95% “Very Satisfied” + 5% neutral (ideal)
  • vs. 95% CSAT: 95% “Satisfied” + 5% “Very Dissatisfied” (problematic)
 

Action: Create note distribution chart for true trends.

Step 2: Segment Results

Segmented analysis uncovers global score insights:

  • By Channel: Email 85%, Phone 92%, Online Chat 78%, Social 65% → Prioritize chat/social improvements
  • By Customer Type: New 75%, Regular 88%, VIP 82% → Review new customer onboarding
  • By Product/Service: Product A 90%, B 72%, After-sales 85% → Fix Product B quality/fit
  • By Geography: Paris 88%, Lyon 92%, Marseille 73% → Focus Marseille agency (training/process)
 

Step 3: Leverage Customer Verbatims

Qualitative comments answer “Why?” as crucially as numbers.
Best practices:

  • Semantic analysis tools for recurring themes

  • Categorize by topic (delays, quality, price, welcome)

  • Quantify themes by % for action prioritization

  • Cross-reference verbatims with scores for satisfaction levers
    Example: 35% mention delivery delays → Priority: Improve delivery/communication.

Step 4: Identify Critical Moments

Not all touchpoints equal; some disproportionately impact satisfaction.
E-commerce example:

  • Order confirmation: Low CSAT impact

  • Delivery experience: Major (30% final score)

  • After-sales: Critical (can flip promoters to detractors)
    Method: Measure CSAT at journey moments for “moments of truth.”

Step 5: Cross with Other Metrics

CSAT alone insufficient. Enrich with:

  • NPS: Loyalty/recommendation
    CSAT high + NPS low = Satisfied but unengaged (churn risk)
  • CES: Interaction ease
    CSAT high + CES high = Satisfied but struggled (fix processes)
  • Operational KPIs: First-contact resolution, response time, returns, churn

6 Concrete Actions to Improve Your CSAT

Post-analysis, act. Here are most effective levers.

1. Prioritize Dissatisfied Customers

Never ignore negative CSAT:

  • Respond <24h with empathy, no excessive justification
  • Ask details for deep understanding
  • Offer concrete solution/gesture if appropriate
  • Follow up to confirm resolution
 

Impact: Well-handled dissatisfied customer becomes brand advocate.

2. Continuously Train Teams

Employees core to CX:

  • Regular communication techniques training
  • Share positive/negative verbatims
  • Empower problem-solving without hierarchy approval
  • Recognize individual CSAT performance
 

3. Simplify Customer Journeys

  • Map full journey
  • Identify pain points
  • Eliminate unnecessary steps
  • Automate without quality loss
 

4. Personalize Experience

  • Fine customer base segmentation
  • Tailored messages/offers per segment
  • Accessible interaction history (no repetition)
  • Personalized recommendations
 

5. Proactive Communication

  • Real-time progress notifications
  • Preemptive delay/problem alerts
  • Transparent timelines/processes
  • Regular engagement communication
 

6. Measure Action Impact

Continuous improvement cycle:

  • Set quarterly CSAT targets
  • A/B test improvements on limited segment
  • Measure segment CSAT evolution
  • Scale if positive; iterate next priority

Mistakes to Avoid in CSAT Analysis

  • #1 Global Score Focus: 78% hides segment/channel/product gaps. Dig deeper.

  • #2 Ignore Neutrals: 3/5 neutral = at-risk, not satisfied.

  • #3 No Verbatim Action: Collecting without analysis/action wastes opportunity, frustrates responders.

  • #4 Wrong Context Comparison: Don’t compare after-sales vs. post-purchase CSAT.

  • #5 Aim 100%: Unrealistic long-term with volume. Target excellence (85-92%).

  • #6 Neglect Response Rate: 95% on 2% responses unrepresentative. Boost via short, timely surveys.

Conclusion: CSAT as Strategic Differentiation Tool

Good CSAT insufficient. In competitive markets, CX excellence becomes major strategic edge. CSAT-centric companies see:

  • +25% loyalty
  • Amplified positive word-of-mouth
  • Lower acquisition costs (satisfied recommend)
  • Higher CLV
 

Key Takeaways:

  • Good CSAT relative to sector/context
  • Segmented analysis reveals true opportunities
  • Verbatims as crucial as numbers
  • CSAT improvement continuous process
  • Always combine with NPS/CES
 

Ready to turn CSAT into growth lever? Analyze current results deeply, identify #1 priority, launch first improvement this week.

Armatis helps companies implement CSAT measurement/improvement strategies. Contact us to make CSAT true competitive advantage.

Sources and References

  • American Customer Satisfaction Index (ACSI) – National measure recognized by U.S. federal government, 400+ companies/40+ sectors. theacsi.org
  • Forrester Research – “The US Customer Satisfaction Rankings, 2024” – 98,363 consumers evaluating 223 brands/13 sectors. forrester.com
  • Customer Service Quality Benchmark Report 2022-2024 – 100-1,000 employee firms in software, e-commerce, B2B.
  • Freshworks Customer Service Benchmark Report 2024 – Anonymized data from 17,170 companies/25+ sectors, 37M+ conversations/19M tickets.

Your Outsourcing Partner

Need a partner optimizing customer experience/transforming results?

Fill the form below now for the best solution to your project.

Share on

Ready to offer a premium customer experience?

Discover how we can optimise your strategy with an
innovative, tailor-made model

Black Friday, holidays, sales, or unexpected peaks: Armatis helps you manage critical volumes, adapt your resources, and maintain customer quality.

Join the leaders who trust our multilingual and technological expertise.