What Is CSAT and How Do You Measure It? The Complete Guide

Share on
By

We live in an era of immediacy and complete transparency

A dissatisfied customer no longer keeps frustration to themselves. They share it with thousands of people in a few clicks. Customers now expect quality standards similar to those found in healthcare, where transparent communication and empathy have become the norm.

Unlike other indicators that evaluate overall loyalty, CSAT focuses on immediate satisfaction related to a specific interaction, product, or service. This transactional approach makes it a powerful tool for identifying friction points across the customer journey.

Table of contents
Table of contents

Definition and How CSAT Works

What exactly is CSAT?

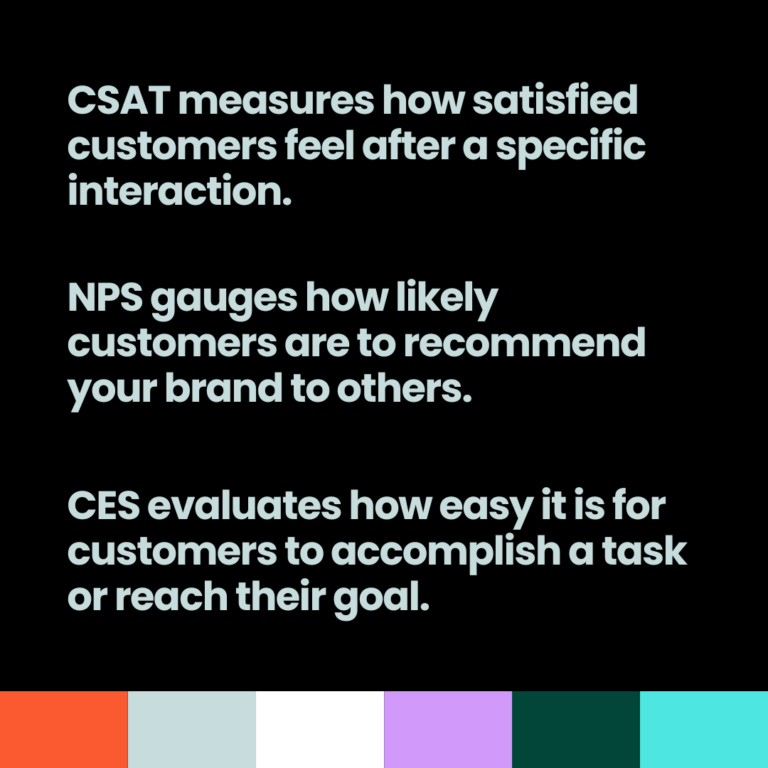
The Customer Satisfaction Score (CSAT) measures how satisfied a customer is after a specific interaction with your company. Unlike metrics that evaluate overall loyalty or level of effort, CSAT captures an emotional snapshot: how the customer feels right now about a particular experience.

Anatomy of a CSAT survey

The question is designed to be simple and direct:

  • “How would you rate your satisfaction with [the interaction/product/service]?”
  • “Are you satisfied with your experience?”
  • “How satisfied are you with your purchase?”
 

Measurement scales

CSAT offers flexibility in its response formats:

Scale TypeDescriptionExample
5‑point scaleMost common, good level of detail1 Very dissatisfied to 5 Very satisfied
3‑point scaleMaximum simplicityDissatisfied, Neutral, Satisfied
10‑point scaleMore granular insights1 to 10
Visual scaleUses graphics⭐⭐⭐☆☆, 👍👎, 😊😐😠


Why CSAT Is So Powerful

1. Simplicity that drives engagement

CSAT questions are short and precise, which leads to high response rates. Unlike long surveys, a CSAT question takes five seconds to complete.

2. Immediate feedback

CSAT captures emotion while it is still fresh. A customer who just had an exceptional or disappointing experience can tell you instantly, allowing you to act before the perception solidifies or before they switch to a competitor.

3. Actionable precision

Since each CSAT score is tied to a specific interaction, you know exactly what works or what needs improvement.
Low CSAT after a support call: training is needed.
High CSAT after a new feature launch: success confirmed.


Why CSAT Has Become Essential

We live in a world where customers speak out quickly. Expectations have shifted toward higher transparency and empathy.

The global customer service software market, valued at 14.9 billion dollars today, is projected to reach 68.19 billion dollars by 2031. This surge demonstrates a key reality: customer satisfaction is no longer a department. It has become the backbone of every successful company.

How to Calculate CSAT: Methods

Method 1: Percentage Calculation (Universal Approach)

Used by 80 percent of companies.

CSAT (%) = (Number of positive responses / Total responses) × 100

Positive responses usually correspond to scores of 4 or 5 on a 5‑point scale.

Example
Total responses: 200
Positive responses: 160
CSAT = (160 / 200) × 100 = 80%


Method 2: Average Score (More Nuanced)

This calculates the average of all responses.

Average CSAT = Sum of scores / Number of responses

Example
20 responses with a total of 80 points
Average CSAT = 80 / 20 = 4 out of 5

Which method to choose?

Percentage is preferred because it shows what portion of customers can genuinely be considered satisfied.

When to Measure CSAT: Strategic Moments

Measuring CSAT is like taking a patient’s pulse. The wrong timing can distort the diagnosis.

1. Immediately after a support interaction

Emotion is fresh. This is the best time.

2. Within 24–48 hours after a purchase

Ideal for e‑commerce, where average CSAT scores reach 82 percent.

3. After onboarding

To confirm whether the customer understands the product.

4. Six months before renewal

A preventive strategy that avoids contract loss.

5. At key journey milestones

New feature use, major update, subscription changes, or regular cycles.

Golden rule: Never overwhelm customers with surveys.

What You Should Never Do

  • Send surveys daily
  • Ask before the full experience
  • Send across multiple channels simultaneously
  • Request feedback during an unresolved frustration


What Is a Good CSAT Score?

A good CSAT score typically falls between 75% and 85%, indicating a high level of satisfaction where most customers are happy with their experience—driving loyalty and positive word of mouth. Scores below 50% are generally considered poor, highlighting serious issues that require immediate attention to prevent customer churn. These thresholds aren’t absolute but serve as useful benchmarks for evaluating performance against customer expectations and competitors.

Industry benchmarks

Benchmark data shows that average scores vary significantly across sectors: hospitality and banking often exceed 79–82%, while insurance usually ranges between 70–76%, according to recent studies.

A “good” CSAT in insurance doesn’t necessarily represent the same level of performance as a “good” CSAT in grocery retail or e‑commerce, where top performers often surpass 80%.

Beyond cross‑industry comparisons, it’s equally important to track your own trend: a 5‑point increase over a year can be more meaningful than a 2‑point gap with the market average. A stable score above your industry average shows that your brand consistently delivers on its promise, while a declining score may indicate a potential risk—even if the absolute value still looks “acceptable.”

Beyond sector comparisons, it is also important to track your own trend: a 5-point increase over one year may be more significant than a 2-point difference from the market average.

Defining your “good” internal CSAT score

It’s recommended to segment your CSAT results into three distinct levels, each tied to a clear course of action:

  • Alert threshold (below 60–70%): This level reflects notable dissatisfaction. It calls for swift intervention through in‑depth diagnostics, targeted action plans, and enhanced qualitative feedback to identify and resolve root causes.
  • Comfort zone (between 75% and 85%): At this stage, the majority of customers report being satisfied, confirming the strength of your operational foundations. It also presents an opportunity to keep improving and further enhance the quality of the experience delivered.
  • Excellence zone (above 85–90%): This score indicates exceptional satisfaction, often seen as a lasting competitive advantage. Maintaining this level involves deepening customer loyalty and leveraging high satisfaction to drive positive recommendations, supported by metrics such as NPS.
 

CSAT vs NPS vs CES: The Complementary Trio

IndicatorWhat it measuresWhen to useStrengthLimitation
CSATSatisfaction with a specific interactionAfter support, post‑purchase, onboardingInstant feedbackDoes not predict loyalty
NPSLikelihood of recommendationRegular cyclesPredicts growthDoes not explain the score
CESEffort required to complete a taskAfter support or journey testsIdentifies frictionEase does not guarantee satisfaction

Want to truly understand your customers? One single metric will never be enough.

CSAT: The moment‑to‑moment thermometer

What it measures: Satisfaction after a specific interaction
The question: “How satisfied are you with [this interaction]?”
Scale: 1–5 or percentage
Focus: Short‑term, transactional, emotional

When to use it:

  • After each support interaction
  • Post‑purchase
  • After onboarding
  • Following key moments in the customer journey
 

Its superpower: It instantly tells you whether you succeeded or failed in a given interaction.
Its limitation: A customer may be happy with a purchase but never come back. CSAT doesn’t predict loyalty.

NPS: The growth predictor

What it measures: Willingness to recommend
The question: “On a scale of 0 to 10, how likely are you to recommend our company to a friend or colleague?”
Scale: 0–10 (Detractors 0–6, Passives 7–8, Promoters 9–10)
Focus: Long‑term, loyalty, advocacy

When to use it:

  • Quarterly or bi‑annually

  • After several months of relationship

  • To measure overall brand health

Its superpower: It predicts your future growth. Promoters buy more, stay longer, and bring new customers for free.
Its limitation: It doesn’t tell you why your customers love or hate you or what to do about it.

CES: The friction detector

What it measures: The effort required from the customer

The question: “On a scale of 1 to 7, how easy was it to [complete this task]?”
Scale: 1–7 (1 = very difficult, 7 = very easy)
Focus: Simplicity, smoothness, efficiency

When to use it:

  • After a support request

  • During a purchase or return process

  • After using a new feature

  • When testing a new journey or experience

Its superpower: It pinpoints exactly where customers struggle. A low CES is often the best predictor of churn—make things easy, and customers stay.
Its limitation: A process can be simple but still disappointing. Ease doesn’t guarantee satisfaction.

How to use the three together

Taken individually, CSAT, NPS, and CES each tell one part of the story. Combined, they provide a complete view of the customer experience: immediate, functional, and relational.

  • CSAT captures real‑time satisfaction right after an interaction, showing how the customer feels about the experience in the moment.

  • CES reveals the effort needed to achieve their goal, shedding light on friction points in the journey.

  • NPS takes a step back to assess how likely the customer is to recommend your brand — a long‑term sign of loyalty and connection.

These three metrics reinforce each other. Too much effort (low CES) drags down satisfaction (CSAT) and ultimately loyalty (NPS). Conversely, a smooth and enjoyable experience boosts both immediate satisfaction and future recommendations.

Using all three isn’t just about tracking scores — it’s about driving action. By cross‑analyzing the results, you can explain performance gaps, identify improvement levers, and directly link operational efforts to your brand’s overall success.

Advantages of CSAT

AdvantageImportanceImpact
SimplicityEasy to ask and answerQuick adoption
Real‑time feedbackInstant measurementFast detection of issues
BenchmarkingCompare easilyClarifies priorities
Actionable dataHighlights where to actEfficient action plans
VersatilityFits all interactionsBroad experience coverage

2. Simplicity

One question, one score, one decision.

2. Real‑time feedback

Instant visibility on issues such as delivery delays or support quality.

3. Competitive comparison

Helps position your brand within your market.

4. Actionable data

Clearly identifies what requires improvement.

5. Versatility

Applies to support, purchase, product use, delivery, onboarding, and more.

Limitations of CSAT

LimitationMeaningImpact
Short‑term viewMeasures immediate emotionLacks long‑term insight
Not explanatoryA number does not say whyRisk of misinterpretation
Extreme biasMostly very happy or very upset respondentsDistorted reality
External influencesContext affects scoreWrong readings
Simplistic categorizationPositive vs negative hides nuancePoor decision‑making

1. Une vision court-terme qui peut induire en erreur

Le CSAT mesure l’instant T, pas la relation. Un client peut adorer son expérience aujourd’hui puis quitter votre marque trois mois plus tard parce qu’il a trouvé une alternative plus pratique, plus rapide, ou moins chère.

Ce que le CSAT ne montre pas :

  • la qualité de la relation globale avec la marque,
  • l’évolution du sentiment sur plusieurs mois,
  • le niveau de fidélité ou de risque de départ.
 

C’est pour cette raison que le CSAT doit toujours être croisé avec d’autres indicateurs comme le NPS ou les analyses de churn. Sinon, vous naviguez avec une seule lampe de poche dans une pièce immense.

2. Un score qui manque souvent de profondeur

Un 3/5 ne vous dit… rien.
Était-ce le produit ? Le packaging ? Le délai ? L’humeur du client ? Une mauvaise journée au bureau ?

Un chiffre seul est un résultat sans explication, et c’est l’un des grands pièges du CSAT.

La solution est simple et redoutablement efficace : ajouter une question ouverte, même très courte. « Pouvez-vous nous en dire plus ? »
Ces quelques mots transforment un score muet en un feedback exploitable. C’est souvent là que se cachent les insights les plus précieux.

3. Le biais des extrêmes qui déforme vos résultats

Le CSAT attire principalement les clients qui ressentent quelque chose de fort :

  • Ceux qui sont enchantés et veulent le dire.
  • Ceux qui sont furieux et veulent se faire entendre.
 

Le client moyennement satisfait, celui qui a eu une expérience “normale”, répond rarement. Il lit l’email, hésite, referme. Silence radio.

Résultat :
Votre mesure sur-représente les extrêmes et ne reflète pas toujours le ressenti du “client moyen”, celui qui fait pourtant 80 % de votre business.

4. Un indicateur sensible à l’humeur et au contexte

Le CSAT n’est pas isolé du monde. Il prend aussi les coups des circonstances extérieures.

  • Une mauvaise nouvelle économique ? Votre score chute.
  • Un concurrent fait la une pour un scandale ? Votre score grimpe par contraste.
  • Une canicule qui ralentit les livraisons dans tout le pays ? Vous encaissez la frustration des clients sans en être responsable.
 

Moralité : n’interprétez jamais un score isolé. Analysez les tendances sur plusieurs semaines ou mois. La stabilité dit plus que la photo du jour.

5. Une lecture binaire qui simplifie parfois trop

La méthode classique du CSAT (4–5 = satisfaits, 1–3 = insatisfaits) masque une réalité plus nuancée.
Un client qui met 3/5 n’est pas dans le même état d’esprit qu’un client qui met 1/5 :

  • l’un est déçu,
  • l’autre est probablement en colère, prêt à le faire savoir.
 

Les traiter comme un seul et même groupe est une erreur stratégique : on ne soigne pas un simple rhume comme une fracture.

Conclusion

The Customer Satisfaction Score (CSAT) should never be seen as an end in itself, but rather as a quick diagnostic tool. Taken alone, it reflects immediate customer sentiment; combined with other data, it becomes a powerful driver of continuous improvement.

In practice, effective CSAT management relies on three key principles:

  1. 1. Measure regularly—but with purpose. Each survey should have a clear goal and be placed at the right stage of the customer journey.
  2. 2. Cross‑analyze your metrics. Combine CSAT, NPS, and CES to turn emotional feedback into a 360° strategic view.
  3. 3. Act quickly on weak signals. A single negative comment may reveal a deeper issue; consistently positive feedback can inform your best practices going forward.
 

Companies that truly get value from CSAT are those that know how to listen, understand, and respond before small irritations become losses. In a world where customer loyalty is earned at every interaction, immediate satisfaction remains the best starting point for building a lasting and memorable experience.

Share on

Solve your customer experience challenges now

Discover how we can optimize your relational strategy with an innovative, tailor‑made model.

Black Friday, holidays, sales, or unexpected peaks: Armatis helps you manage critical volumes, adapt your resources, and maintain customer quality.

Join the leaders who trust our multilingual and technological expertise.